Nick Miller Marketing Message me on LinkedIn

Be the brand your competitors try to copy.

Book a call

Nick Miller

Let's Move the Needle

You're a $1M-$20M founder. You've built something that works, and you know it could be growing faster.

It can feel like making high-stakes decisions on the fly, burning cash on tests, and wondering why growth has stalled.

Agencies feel like a risky, necessary evil. They send polished slide decks that cherry-pick the best metrics, and leave you asking, "Why am I still not making money?"

Most media buyers optimize for ROAS. Almost none connect paid ads to your P&L - your contribution margin, cash conversion cycle, and unit economics. So your campaigns can look good in the ad platform while you lose money every month.

You might see brands you think are pulling ahead of you, and you can't tell if they're just lucky or if they have something you don't.

Or you're drowning in data but can't name the one or two psychological levers that make customers buy from you.

You want a shortcut through all of this, so you can get back to what you're best at and what you're passionate about.

I don't run growth like a media buyer.

I run growth like an operator.

Nick Miller
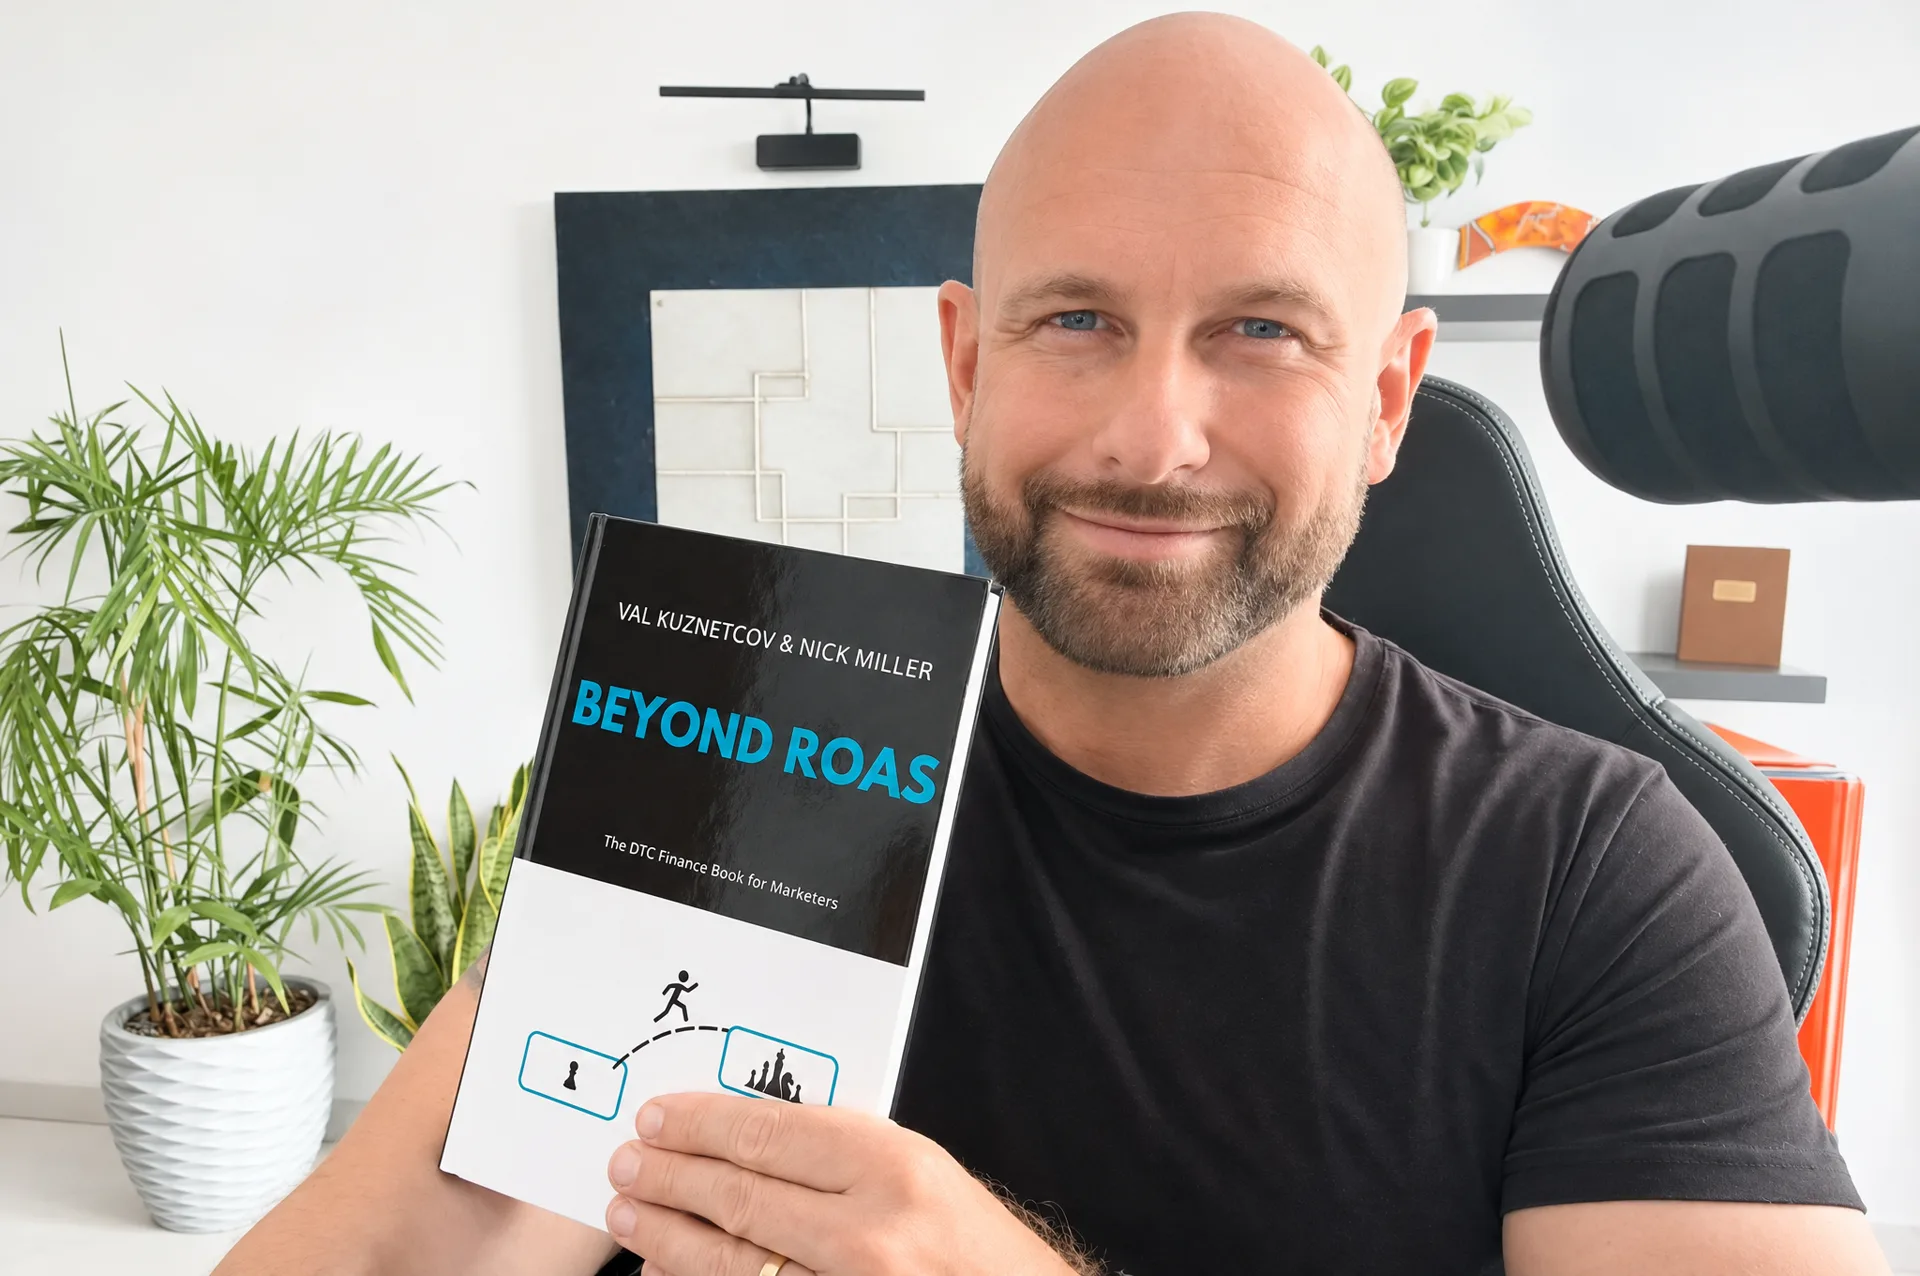
Nick Miller at his desk holding a copy of Beyond ROAS

Profit

What’s your biggest lever?

1Annual revenue (start here)

2Average order value (AOV)

3Gross margin

4Cost to get a new customer (nCAC)

5Move a lever

0%

0%

0%

$925,000

Profit contribution

Move a lever to see the change

0.67x

First-order LTGP:nCAC

How it works

In this example brand, 42% of revenue comes from first orders. At $5M revenue and a $60 AOV, that's 35,000 new customers and 48,333 returning orders a year ().

Profit contribution is gross profit minus the cost of getting new customers: Fixed costs and overheads aren't in this number.

First-order LTGP:nCAC is the gross profit on a first order divided by what it cost to get that customer:

Biggest lever. Each lever is improved by 10% on its own (more new customers, a lower nCAC, more returning orders), and the one that adds the most profit contribution is ranked first.

Move the Needle analysis

Sample data

1 · Profit and efficiency

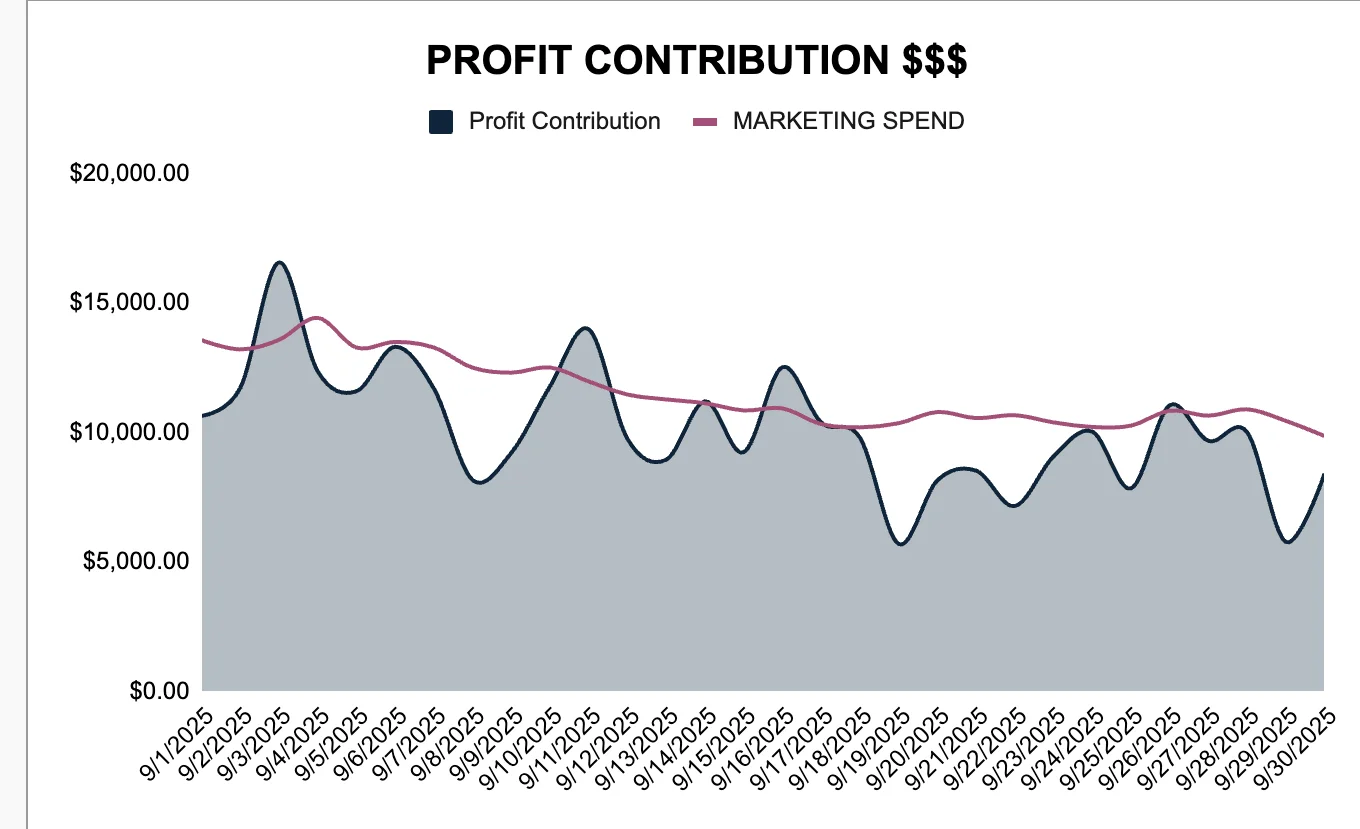
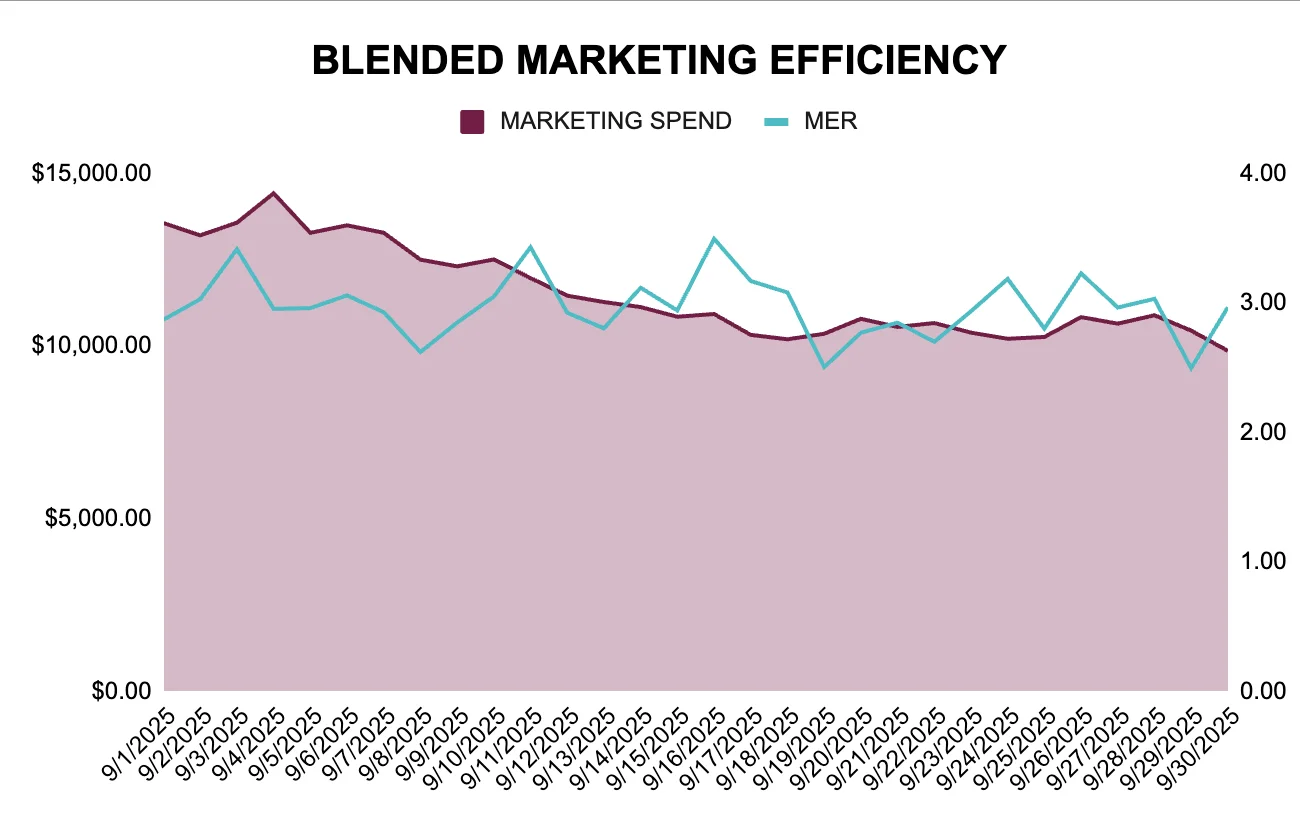
Is marketing making money?

Chart: daily profit contribution against marketing spendChart: daily marketing spend against blended marketing efficiency (MER)

2 · Margins and levers

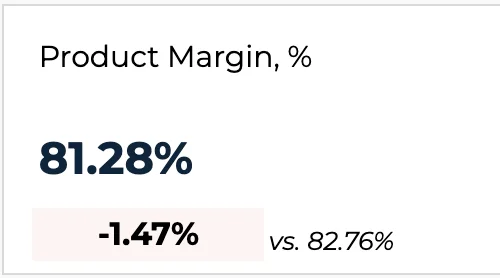
Where is margin leaking?

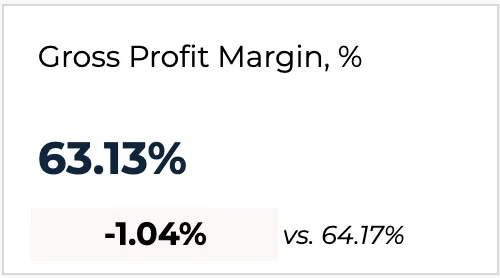
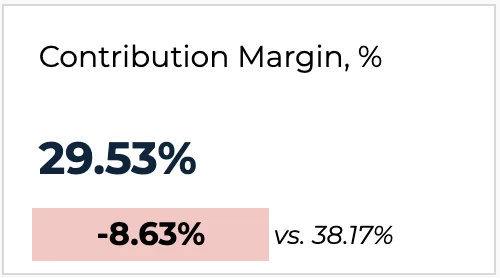
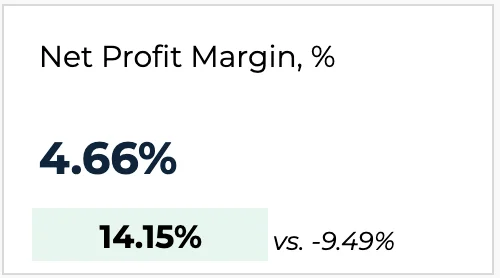
Product marginGross profit marginContribution marginNet profit margin

3 · Acquisition

Is growth paying back?

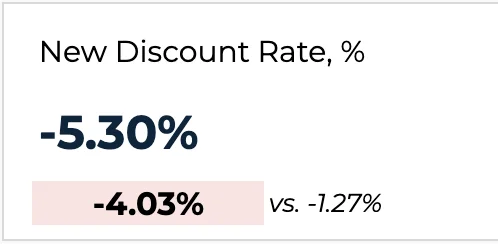
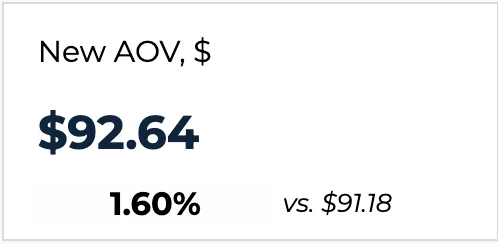
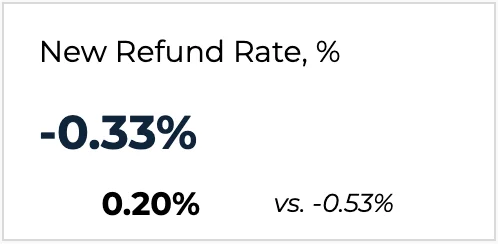
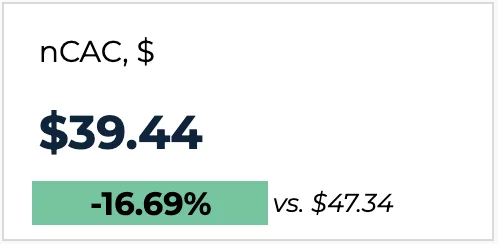
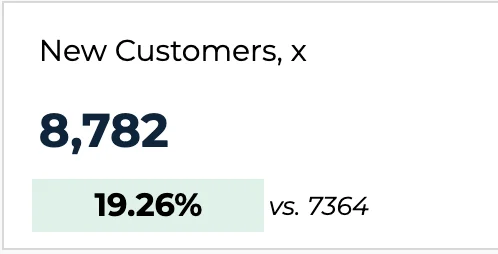
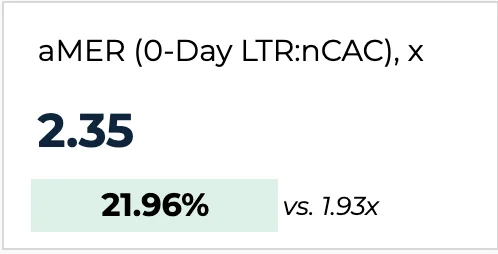
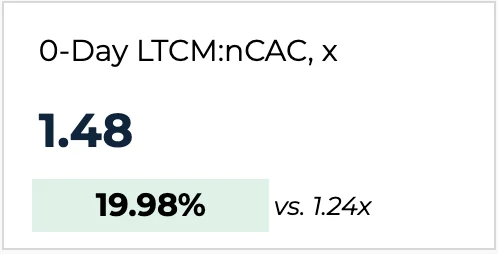
New discount rateNew AOVNew refund ratenCACNew customersaMER (0-day LTR to nCAC)0-day LTCM to nCAC

4 · Retention

Do customers come back?

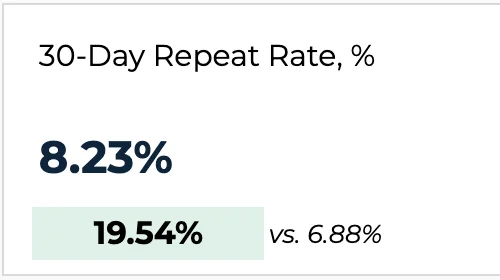
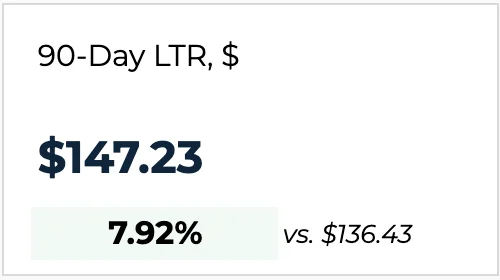
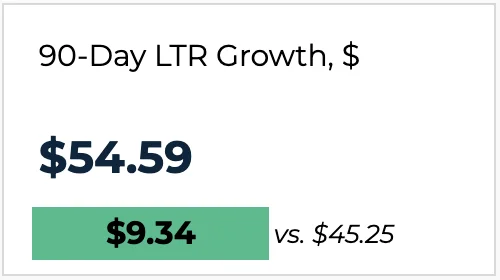
30-day repeat rate90-day LTR90-day LTR growth

“He understands how marketing fits into the broader financial and operational engine of a business, and he builds strategies that stand up in the boardroom, not just in reporting tools.”

Adrian DeweyAdrian Dewey
Former CFO, Tier 11

You're bound to have questions. Schedule a 15-minute discovery call so we can cut the bs and talk about your brand.

Get my book "Beyond ROAS"

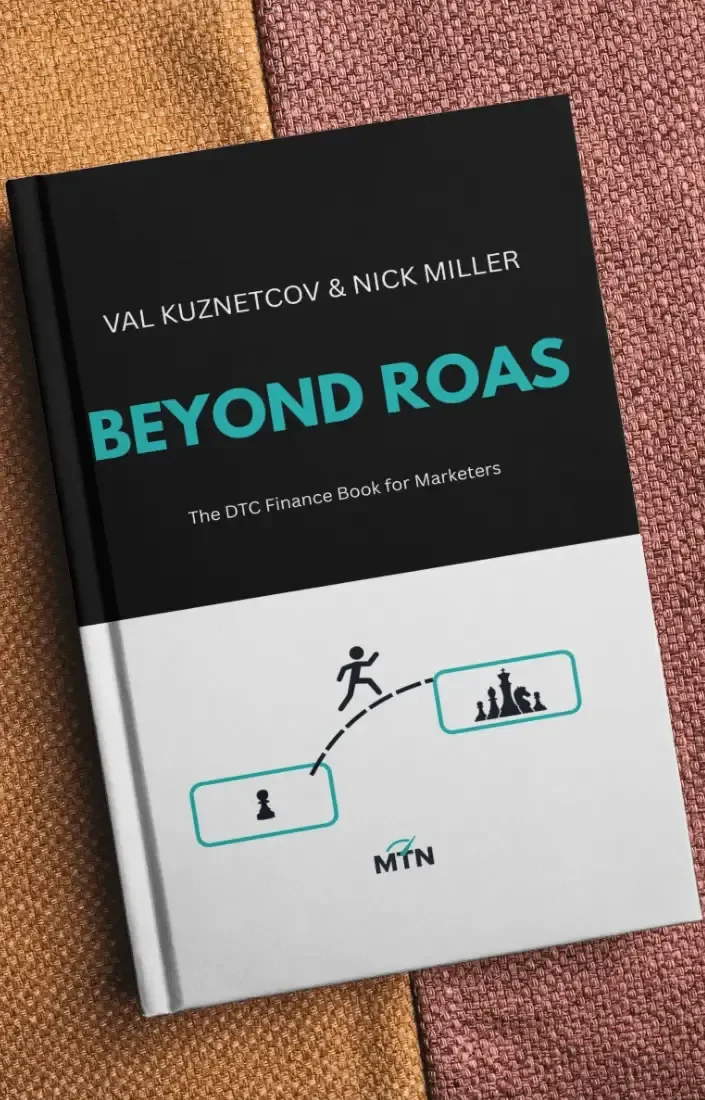
Beyond ROAS, The DTC Finance Book for Marketers, by Val Kuznetcov and Nick Miller